7 Candlestick Signals Essential for Forex Success

Light Up Your Forex Strategy with Candlestick Signal Essentials
Understanding candlestick patterns is crucial for anyone involved in forex trading.
These patterns do more than chart price movements—they provide deep insights into market sentiment and potential shifts, offering traders a strategic advantage.
Why should I care?
Well, every trader, whether novice or seasoned, needs more than just basic market awareness. Understanding candlestick patterns allows you not only to observe market movements, but also to anticipate them. These patterns unveil the underlying market sentiment and potential shifts, proving indispensable for traders aiming to stay proactive rather than reactive.
Whether it's the cautious hesitation of a Doji or the assertive confidence of a Bullish Engulfing, each candlestick pattern weaves part of a larger narrative. And in the world of forex trading, being able to read these stories isn't just useful—it's essential.
By the end of this blog, you'll not only recognise these patterns but also understand what they signify and how they can inform your trading decisions, seamlessly integrating with other analytical tools in your toolkit.
Ready to improve your trading strategy? Let's dive in!
Igniting the Basics: The Core Elements of Candlesticks
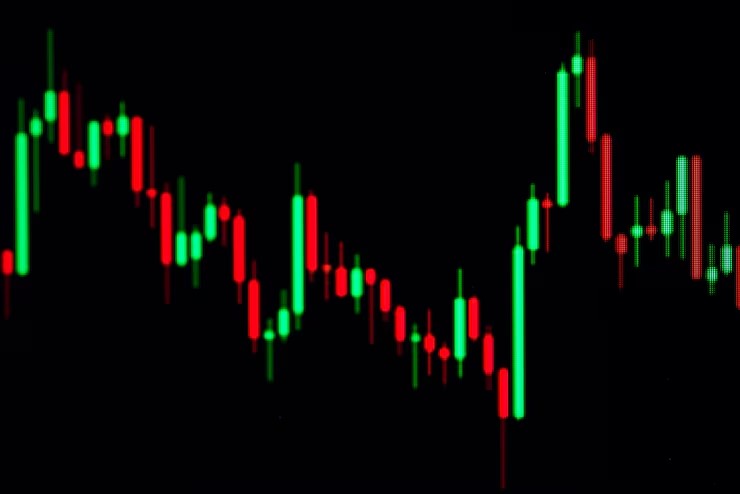
Candlestick charts do much more than display data; they paint a dynamic picture of the market's emotional landscape. Each candlestick captures a snapshot of the ongoing tug-of-war between bulls and bears, encapsulating the story of price action.
At their core, candlesticks reveal four critical points in their formation. Here's a breakdown of what each element of a candlestick tells you:
- Open: The price level at the start of the trading period, setting the stage for the session's activity.
- Close: The final price at which the session closes, sealing the outcome of the day's engagements.
- High: The peak price during the session, representing the height of buyer enthusiasm.
- Low: The lowest price point during the session, indicating the depth of seller pressure.

How to Read a Candlestick
The 'body' of the candlestick, the thicker part, shows the range between the opening and the closing prices. Its colour—white or green for a close higher than the open (bullish), and black or red for a close lower (bearish) — provides immediate insight into market sentiment.
Meanwhile, the 'wicks' or 'shadows', the thin lines extending from the body, represent the price extremes within the candle's timeframe. A long upper wick indicates that buyers initially pushed prices up, only for sellers to counteract, while a long lower wick indicates sellers drove the prices down before buyers intervened.
Understanding these fundamental elements not only clarifies the candlestick's formation but also enriches your grasp of market dynamics. A long-bodied candle with minimal wicks indicates a session dominated by a strong directional push with little resistance, while a short-bodied candle with long wicks signals a session of uncertainty and balanced power struggle.
7 Candlestick Signals You Need to Master
Now that you know the basics of reading a candlestick, let's dive into specific patterns you should be aware of:
- The Doji: Characterised by its thin line, the Doji appears when the opening and closing prices are virtually identical. This pattern is a classic sign of market indecision. While a singular Doji can suggest a pause in trend, consecutive Dojis might indicate a more significant impending reversal, especially after a pronounced trend. Observing the candles that follow is essential for confirmation.
- Hammer and Hanging Man: These patterns are identified by their small bodies and long lower wicks. The Hammer, appearing during a downtrend, signals a potential bullish reversal, as it indicates that despite selling pressure, buyers managed to close the session near the open. Conversely, the Hanging Man forms at the peak of an uptrend, hinting at a possible bearish reversal as buyers fail to maintain price levels by the close.
- Bullish and Bearish Engulfing: Comprising two candlesticks, these patterns show a significant power shift between buyers and sellers. A Bullish Engulfing pattern occurs when a small bearish candle is followed by a much larger bullish candle, engulfing the first. This pattern suggests that buyers have overwhelmed sellers, potentially leading to an upward reversal. The Bearish Engulfing pattern is the reverse, indicating strong selling pressure overpowering buyers, leading to a potential downturn.
- Shooting Star and Inverted Hammer: These are identified by a small body with a long upper wick. The Shooting Star occurs after an uptrend and signals a potential bearish reversal, as it shows that buyers tried to continue the trend but sellers took over and pushed the price back down. The Inverted Hammer, meanwhile, appears during a downtrend and suggests a possible bullish reversal, indicating buyers are beginning to overpower sellers.
- Morning Star and Evening Star: These three-candlestick formations signal major shifts in market sentiment. The Morning Star, a bullish reversal pattern, begins with a long bearish candle, a gap down to a small-bodied candle, and ends with a long bullish candle that closes above the midpoint of the first candle's body. It suggests a strong turnaround from a downtrend. The Evening Star pattern, signaling a bearish reversal, mirrors this setup at the end of an uptrend.
- Three White Soldiers and Three Black Crows: These sequential patterns are strong momentum indicators. Three White Soldiers, consisting of three long and bullish candles, suggest a robust uptrend as buyers progressively gain more ground. Conversely, Three Black Crows feature three long and bearish candles indicating a powerful trend, as sellers take control session after session.
- Harami Pattern (Bullish and Bearish): This pattern features a small candle fully enclosed by the body of a larger previous candle. A Bullish Harami occurring after a downtrend suggests the selling pressure is diminishing and a reversal might be on the horizon. A Bearish Harami, appearing after an uptrend, signals that buying pressure is waning, potentially leading to a downward reversal.
Applying Candlestick Signals in Real Trades
How to Use Candlestick Patterns
Mastering the art of using candlestick patterns effectively in forex trading involves more than recognising shapes on a chart. It's about integrating these patterns strategically with a solid trading plan and leveraging additional technical tools to ensure precision and mitigate risks.
Here's how to transform your knowledge of candlestick patterns into actionable trading strategies:
- Context is Key: Always analyse candlestick patterns within the context of the broader market trends and other relevant technical indicators. A candlestick pattern that aligns with the prevailing trend, for instance, a Bullish Engulfing pattern during an uptrend, offers a high probability of success compared to a pattern that contradicts the trend.
- Seek Confirmation: Relying on a single candlestick pattern can be risky. Instead, wait for additional confirmation from subsequent candles or other technical indicators` to validate the pattern. This step is crucial to mitigate the risk of acting on false signals. For example, a Hammer pattern followed by a bullish engulfing candle provides stronger confirmation of a potential upward reversal.
- Integration with Technical Indicators: Candlestick patterns work best when used in conjunction with other technical analysis tools. This combination validates signals and sharpens the precision of your trading decisions. Integrating tools like Moving Averages, RSI and MACD, among others, can provide additional layers of signal confirmation, ensuring a more grounded trading strategy. (For a deeper understanding of these tools, you can read out comprehensive guide here.)
From Patterns to Profits: Enhancing Your Forex Strategy
Effective trading is not just about recognising opportunities; it's about capitalising on them while managing risk effectively.
- Entry and Exit Points: Define clear criteria for entering and exiting trades based on candlestick patterns and confirmed by additional indicators. For example, enter a trade on a bullish engulfing pattern only if it is supported by a high volume and the RSI moving out of oversold conditions.
- Risk Management: Implement strict stop-loss orders to protect your investments. Place stop-loss orders just below the low of a bullish pattern or above the high of a bearish pattern to limit potential losses if the market moves against your position.
- Continuous Learning: The forex market is dynamic, and continuous education is key to staying ahead. Regularly review your trading strategy and adjust it based on new information and changing market conditions to ensure it remains effective.
Take Your Trading to the Next Level with FXDD
Candlestick patterns are more than just chart formations; they are the language of the market. By learning this language, you can anticipate and react to market changes more effectively, giving you an edge in your trading activities. At FXDD, we are committed to empowering you with the knowledge and tools necessary to master this skill.
Are you ready to take the next step in your trading journey? FXDD is here to guide you every step of the way. With our advanced trading platforms and comprehensive support, you can refine your market analysis skills and discover the secrets to mastering the subtle art of candlestick trading and identifying pivotal market movements.
Register now and learn how FXDD can help you harness the full potential of candlestick patterns and more.
Act now and take control of your trading destiny with FXDD — your partner in Forex success!

